


Knowledge
-
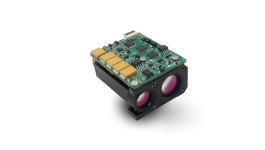
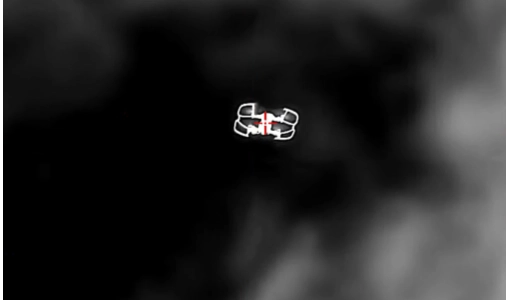 Introduction to Anti-UAV system and technology
 -
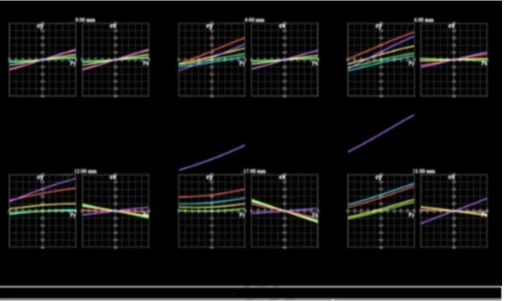 Image quality evaluation-aberration curve
 -
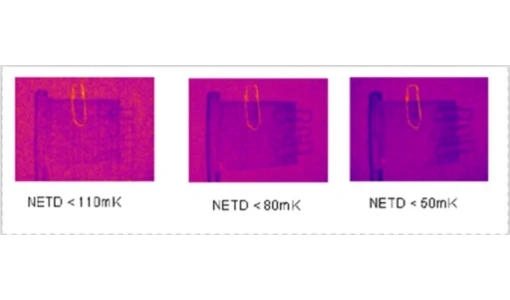 What is NETD in a Thermal Camera?
 -
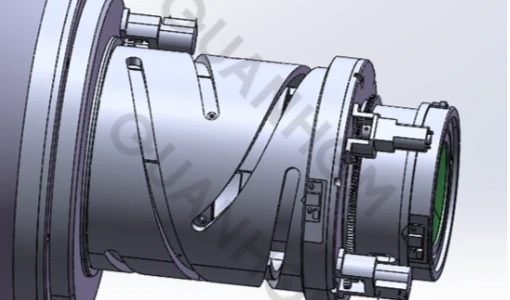 Structural design of continuous zoom lens
 -
 What is the sensor size?
 -
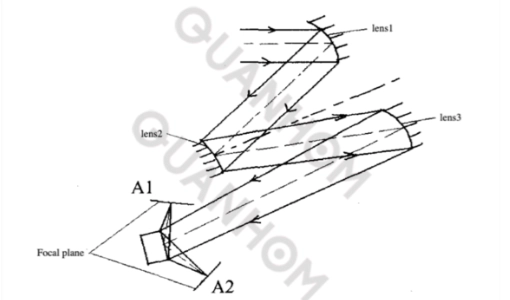 Infrared Optical System Structure
 -
 What Are The General Design Principles Of The Mounting Base Of The Infrared Optical Lens?
 -
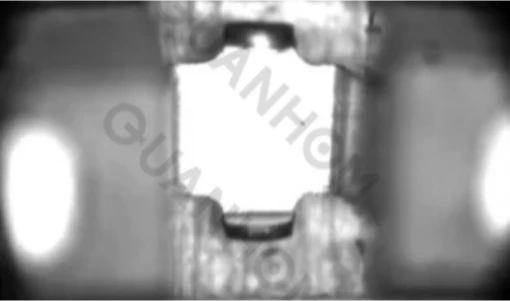
 What Are Bad Pixels, Ghost Images And Vignetting effect In Infrared Imaging?
 -
 Design Of High-Resolution Long-Wave Infrared Continuous Zoom Optical System