

The influence of the quality of optical components on the signal-to-noise ratio of infrared optical system
With the development of modern science and technology, more stringent requirements have been put forward for optical systems, and the limitations of the processing technology and operating environment of optical components have inevitably caused "defects" and surface contamination such as impurities, scratches, and pitting. The most common stray light in an optical system enters the optical system at an oblique angle outside the field of view, and then is scattered into the field of view by mechanical parts and enters the subsequent optical path. This kind of scattering is usually easily eliminated.
However, it is much more difficult to eliminate the light that is incident on the lens or mirror first, and then scattered into the field of view by the surface of the optical element to enter the field of view of the optical system. This kind of scattering is usually caused by the following two factors:
(1) Scattering caused by surface scratches, pitting or other defects larger than the wavelength of light compared with the wavelength of light;
(2) Since high-quality optical surfaces are almost defect-free, the scattering comes from small irregularities on the surface caused by polishing or other processes.
Under normal circumstances, due to the limitations of modern processing technology, optical components will inevitably leave various defects in the substrate processing process. In addition, during the use of the optical element, its surface will also be polluted.
This defect and surface pollution will cause different degrees of scattering of human light, which not only increases the loss of light energy, but also causes the deterioration of the imaging quality of the infrared optical system, which in turn affects the extraction and analysis of the target signal by the infrared optical system. , It is necessary to study the influence of optical component defects and surface pollution on the stray radiation performance of the system.
Early stray radiation analysis of infrared optical systems mainly relied on manual experience estimation. With the development of computer technology, a large number of stray radiation analysis software emerged, including ASAP, Zemax and TracePro. The research on the surface contamination of optical system components abroad is relatively early and the literature is mostly concentrated between 1980 and 2000. In 1996, A.C. Terrible of NASA's Space Flight Center and others discussed the impact of component surface pollution on space equipment and the control of pollution.
In 1999, Pierre Y. Bely, Matt Lallo of NGST (Next Generation Space Telescope) Institute of Space Telescope and Keith Parrish of Goddard Space Flight Center carried out system spurious radiation analysis based on the Yardstick project and discussed the surface contamination of components The impact of objects on the stray radiation performance of the system.
The domestic research on the surface pollution of optical components started late, and the related work is not much, but with the gradual attention to the pollution problem. Some research progress has also been made. In 2012, Xiao Jing et al. carried out an analysis of the impact of optical component surface contamination on the system signal-to-noise ratio, and believed that when the coverage of the optical component surface pollution particles reaches a certain level, it will affect the detection of weak signals by the optical system.
In 2015, based on the non-uniform cluster pollution model on the surface of the optical element, Wu Jianpeng and others studied the influence of the cluster chopsticks pollution of the infrared optical system on the stray radiation characteristics of the system.
Given a particle pollution level of 300 on the surface of the primary mirror, based on the Mie scattering theory, the scattering characteristics of the primary mirror substrate with different defect levels are quantitatively analyzed, and then the primary mirror scattering model is established. On this basis, taking the RC optical system as an example, combined with the ASAP optical analysis software, the system's stray radiation characteristics of the moderate pollution on the surface of the main mirror and its substrate under different defect levels were simulated and analyzed, and the corresponding the calculations of signal-to-noise ratio were obtained.
1. Basic model
1.1 Mie scattering model
According to the principle of interaction between light and matter, when a beam of light enters the medium, a series of physical phenomena such as transmission, refraction, and scattering will occur. For scattering, it can be divided into elastic scattering and inelastic scattering. For elastic scattering, it mainly includes Rayleigh scattering, Mie scattering and non-selective scattering. Its characteristics are closely related to the incident light wavelength, the size, density and shape of suspended particles in water.
Generally speaking, when the particle size in the medium is much smaller than the wavelength of the incident light wave, Rayleigh scattering can be used to characterize the relationship between the scattered light intensity and the wavelength of the light wave, and when the particle size is equivalent to the wavelength of the light wave, Mie scattering can be used for Characterization.
As early as 1908, Gustav Mie proposed the light scattering theory when explaining the various colors of light scattering and absorption by tiny gold colloidal particles (gold sol particles) suspended in water, which was later called Mie scattering theory.
According to the Mie scattering theory, it can be obtained that the scattered light intensity distribution of any spherical particle is closely related to the particle size and distribution of the particle. For a particle system with multiple particle size distributions, it can be known from the Mie scattering theory that when a single spherical particle is irradiated with a monochromatic plane wave with a wavelength of λ and a light intensity of I0, the scattered light will be on the photodetector. The light energy scattered on a ring is:
In the formula, θ is the scattering angle; Wj is the mass of the particle with a diameter of dj; p is the density; i1 and i2 are the scattering intensity functions, which can be expressed as:
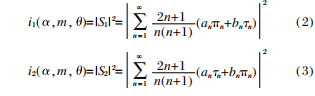
In the formula: an and bn are the Michaelis-Men coefficients, which are the refractive index m of the particle relative to the surrounding medium and the function of the dimensionless parameter α=(πd/λ) which characterizes the size of the particle size. The semi-integer order Bessel function and The second kind of Hankel two-number representation; πn and Tn are scattering angle functions, which can be represented by the Legendre and first-order associated Legendre functions of cosθ.
It should be pointed out that the value of n cannot be too small, otherwise the calculation will produce larger errors; similarly, the value of n should not be too large, otherwise the convergence will be slower and the calculation time will be longer. This article refers to the test formula given by Wiscombe to determine the effective value of n.
For spherical particle defects, the angular distribution of light intensity of the scattered field can be obtained from the Mie scattering theory, and then the scattering of particles of different sizes can be calculated. On this basis, by selecting an appropriate statistical model, the total scattering of optical component defects can be calculated.
1.2 Signal-to-noise ratio model
Due to the defects of the optical components and surface contamination in the system, the infrared optical system will not only increase the thermal radiation of the components in the system when detecting weak signals, but also reduce the intensity of the target signal in the field of view and increase the signal strength of objects outside the field of view, thereby reducing the system signal-to-noise ratio. When the infrared optical system detects, the noise of the detector can be divided into three categories:
(1) The inherent noise of the detector, such as composite noise, 1/f noise, thermal noise and shot noise;
(2) Photon noise is the noise caused by the fluctuation of photogenerated electrons generated by the signal and background radiation, which is proportional to the 1/2 power of the number of photogenerated electrons;
(3) Noise generated by a downstream amplifier with a certain frequency bandwidth, such as quantization noise.
The calculation of the signal-to-noise ratio mainly includes the ratio detection rate method and the equivalent electronic method. The equivalent electron method is to express the signal and noise in the form of the number of electrons. It converts the radiation power received by the detector unit into the number of photons, and then obtains the number of electrons from the quantum efficiency of the detector. The equivalent electron number caused by the signal can be expressed as:

In the formula: PS is the target signal intensity; η is the quantum efficiency of the detector; △T is the integration time of the detector; E=hc/λ is the band gap of the detector, h is the Planck constant, and c is the vacuum The speed of light, λ is the detection wavelength.
In the same way, the number of photoelectrons caused by the background radiation power can be expressed as:

In the formula: Pb stands for background radiation power.
In the infrared optical system, in order to effectively suppress the thermal radiation of the system itself, the detector is usually cooled at a low temperature. Therefore, the inherent noise of the detector is much smaller than the background radiation noise. When the target signal radiation power is much smaller than the background radiation power, the signal-to-noise ratio of the infrared optical system can be expressed as:

Equation (6) shows that the system signal-to-noise ratio is proportional to the signal target radiation power and inversely proportional to the square root of the background radiation. In general, infrared optical system detectors are generally limited by background radiation noise when detecting weak signals.
2.System simulation model establishment and signal-to-noise ratio analysis
In order to study the influence of the quality of optical components on the signal-to-noise ratio of the infrared optical system, it is necessary to use ASAP software to establish a three-dimensional opto-mechanical simulation model of the system, and to specify a reasonable scattering model for each component of the system.
2.1 The establishment of the optical machine model
In order to study the impact of particle contamination on the surface of the primary mirror and the replication of substrate defects on the signal-to-noise ratio of the infrared optical system, the R-C optical system is taken as an example. Its structure is shown in Figure 1, and the ASAP optical analysis software is used to establish a three-dimensional simulation model.
The full viewing angle of the system is 1.6°, the entrance pupil diameter is 1200mm, the working waveband is 3-5μm, and the system temperature is 275k. The system does not have a 100% matched cold stop to suppress heat radiation from components outside the field of view.
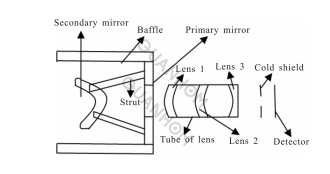
Fig.1 Design schematic of the infrared imaging optical system
2.2 Establishment of the scattering model
After the simulation model of the infrared optical system is established, the premise of stray radiation analysis is to specify the appropriate scattering model for the optical and mechanical parts of the system to characterize the scattering characteristics of its surface. In the calculation, it is assumed that the reflectivity of the mirror is 0.98, and the modified Harvey model is used to describe its scattering characteristics91, and its total integrated scattering TIS is 0.018%.
The transmittance of the lens is 0.99, and the total integral scattering is 0.4%. The reflectivity of the mechanical parts of the system is 2%, and the Lambertian model with a TIS of 2% is used to describe its scattering characteristics. The surface is painted black and the absorption rate is 0.96.
When the surface cleanliness of the optical element is 300, 500, 750 (the particle surface coverage is 0.03%, 0.3%, 2.7%, respectively), it corresponds to the three kinds of mirror pollution of light pollution, moderate pollution and heavy pollution.
Figure 2 shows the normalized distribution of the two-way scattering distribution (BSDF) with the scattering angle (Figure 2(a) 300 grades of mirror surface pollution, Figure 2(b) 500 grades of mirror surface pollution, figure 2(c) 750 degree of pollution on the surface of the reflector). In a large telescope system, the size of the primary mirror is usually larger and processing is more difficult.
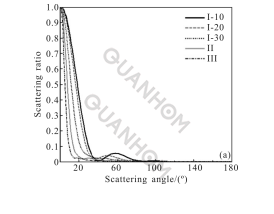
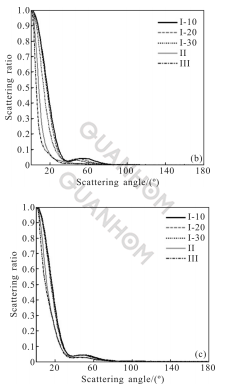
Fig.2 BSDF along with the normalized distribution of the scattering angle
Therefore, this article focuses on the research on the quality of the primary mirror. Taking the case where the main mirror surface contamination is level 300 as an example, the scattering characteristics of different defect levels on the main mirror substrate are fitted with the sum of two modified Harvey models to fit the BSDF data calculated by the Mie scattering model.
The total scattering of the primary mirror is the sum of surface roughness, surface particle contamination and substrate defect replication. The MIL-STD-1246C standard is used to approximate the particle distribution for particle pollution on the surface of the component. The density and size of the pollution particles obey the log-normal distribution, that is

In the formula: x is the size of pollutant particles; N(x) is the number of particles greater than or equal to x per square foot; X1 is the surface cleanliness level of the optical element; C is the normalization constant, and the value of C in this standard is 0.926. Equation (7) shows that the probability of occurrence of small-size particles is higher, while the probability of occurrence of large-size particles is lower. Therefore, in the calculation, it can be approximated that the pollution particles on the surface of the optical element are small-sized particles.
Regarding substrate defects, a large number of experiments and theoretical studies have shown that the size and density of optical element defects obey a power-exponential distribution, that is, the smaller the size, the greater the density:

In the formula: P represents the density when the defect size is, and A and m are two parameters related to optical elements. According to the detection standards for substrate surface defects in the national standard (GB1185-79), component defects can be divided into 10 levels from low to high, such as I-10, I-20, I-30, II, and III. High indicating that the processing quality of the component is worse.
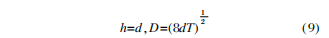
For substrate defect replication, the defect has a cylindrical symmetric structure with a parabolic boundary, and its surface diameter meets the following relationship with the size and depth of the seed:
Sample Content
In the formula: D is the diameter of the film surface defect; d is the diameter of the substrate defect seed; T is the depth of the seed. The calculation assumes that the main mirror substrate material is Si with a refractive index of 3.44-2.4×10, a single layer of Ag film with a thickness of 100nm is plated on the Si substrate, and the protective film is ZnS/YbF3. The calculated wavelength is 4μm.
It can be seen from Figure 2 that the scattering energy caused by the surface contamination of the main mirror and the multiple effects of its substrate defects is mainly concentrated in the forward direction (the scattering angle is between 0°-90°), and when the pollution level of the main mirror surface is given, the substrate The higher the defect level, the more obvious the forward concentration, and the more obvious the impact on the replication of substrate defects.
Comparing Figures 2(a)-(c) further, it can be seen that even if the substrate processing quality is better, if the surface contamination of the optical element is more serious, the greater the amount of scattering it causes. On the contrary, even if the surface of the optical element is slightly contaminated, if the substrate processing quality is worse, the amount of scattering is also larger.
2.3 Analysis of signal-to-noise ratio
Since the signal-to-noise ratio is related to the signal radiation and background radiation received by the detector, it is necessary to analyze the stray radiation characteristics of the infrared optical system. The background radiation received by the detector includes the thermal radiation of the internal components of the system and the stray radiation of external radiation sources. Among them, the external stray radiation sources mainly include the sun and sky background.
2.3.1 Thermal radiation of the internal components of the system
In the case that the surface contamination of the main mirror is level 300, take the RC telescope shown in Figure 1 as an example, the defects of the main mirror substrate are respectively I-10, I-20, I-30, I and II, and the main mirror Preliminary analysis of six conditions of cleanliness (that is, no defects on the substrate and no pollution on the surface of the main mirror) found that the sum of the stray radiation flux of the mechanical parts in the system is greater than the sum of the stray radiation flux of the optical parts. Optimize as follows:
(1) Added a light-blocking ring to the system hood;
(2) Blacken the mechanical parts that are not critical;
(3) For the lens barrel, etc., which are the key surface but not the irradiated surface, roughen it;
(3)For the supporting ribs, etc., which are both the key surface and the irradiated surface, first blacken it and then roughen it. Table 1 shows the stray radiation flux of each element of the infrared optical system reaching the image plane of the detector.
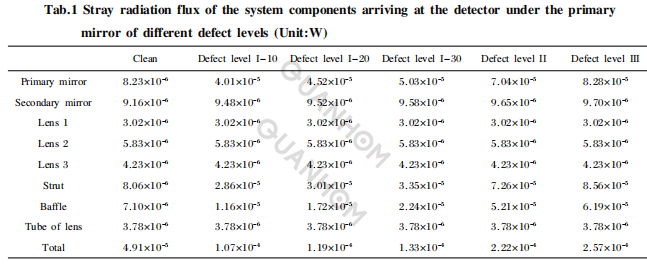
It can be seen from Table 1: In the case of a given primary mirror surface pollution of 300 levels, with the increase of the defect level of the primary mirror substrate, the stray radiation flux of the primary mirror will increase with the increase of its own emissivity. Increase. The stray radiation flux of the secondary mirror is basically unchanged. The main reason is that the secondary mirror is facing the detector, and its own stray cadmium radiation can directly reach the detector, so it is less affected by the defect of the primary mirror substrate.
There is almost no change in the stray radiation flux of the three lenses and the lens barrel, mainly because this element is located in the rear group of the system, and its own stray radiation does not need to be reflected and scattered by the primary and secondary mirrors. The stray radiation flux of the support ribs and the hood will increase with the increase of the amount of scattering on the surface of the primary mirror. The main reason is that the stray radiation of the mechanical parts enters the subsequent optical path through the scattering of the primary and secondary mirrors, and finally reaches the detector.
2.3.2 Analysis of stray radiation characteristics of external radiation sources
Generally, solar radiation cannot directly reach the image plane of the system, and its stray radiation can only reach the detector through the scattering of the internal components of the system. Since the optical system generally does not detect the target directly, it is assumed that the angles between the incident light of the sun and the optical axis of the system are 10°, 20°and 30°respectively, and the sun is regarded as a black body with a temperature of 5900K.
The sky background mainly reaches the focal plane of the detector through the reflection of the primary and secondary mirrors. When analyzing the stray radiation characteristics of the sky background, the sky background is equivalent to a black body of 200-280K. The pollution on the surface of the primary mirror is at 300 level, when the main mirror has different defect levels and the main mirror is ideal, the stray radiation flux of the sun and sky background received by the detector is given in Table 2 with a wavelength of 3-5μm.
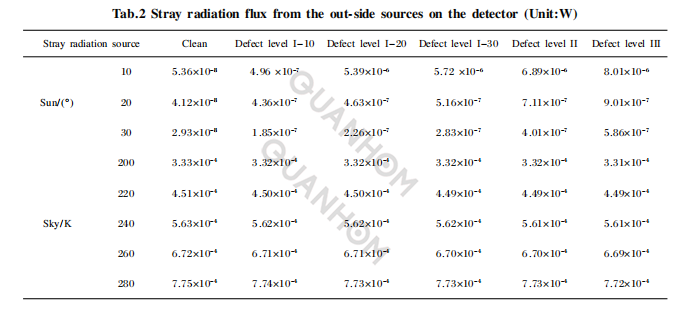
It can be seen from Table 2 that the solar stray radiation flux received by the detector is smaller than the stray radiation flux of the sky background. In addition, when the pollution of the main mirror surface is level 300, when the incident angle of the sun and the optical axis of the system is constant, the solar stray radiation flux received by the detector will increase significantly with the increase of the defect level of the main mirror substrate.
The main reason is that the higher the level of the substrate defect, the greater the amount of scattering on the surface of the component, and the greater the solar radiation energy that is eventually scattered by the mirror and reaching the detector.
When the defect level of the main mirror substrate is constant, as the incident angle of the sun and the optical axis of the system increases, the solar stray radiation flux received by the detector gradually decreases.
When the sky background temperature does not change, the stray radiation flux of different defect levels of the main mirror substrate will gradually decrease as the transmittance of the system decreases, but the change is not significant. When the effective radiation temperature of the sky background changes within 200-280k, the stray radiation flux of the sky background collected by the detector will gradually increase with the increase of its radiation temperature.
2.3.3 Signal-to-noise ratio analysis
It can be seen from Table 1 and Table 2 that the solar radiation received by the detector is smaller than the sky background and the thermal radiation of the internal components of the system. Therefore, when analyzing the influence of the main mirror surface pollution and the different substrate defect levels on the signal-to-noise ratio, only the solar radiation Discuss the situation when the angle between the human beam and the optical axis of the system is 30°. Equation (6) shows that the signal-to-noise ratio of the system is related to the signal radiation and background radiation received by the detector.
The background radiation received by the detector is the sum of the thermal radiation of the internal components of the system and the stray radiation from the sun and the sky. The relative change in the signal-to-noise ratio caused by the contamination and defects of the optical element is only related to the relative magnitude of the signal and background radiation, but not to the initial signal-to-noise ratio when the optical element is clean.
In order to analyze the relative influence of mirror pollution on the signal-to-noise ratio conveniently and intuitively, the signal-to-noise ratio when the mirror surface is clean with different sky background radiation temperatures is set to 1, so as to obtain the target signal intensity for subsequent calculations.
The parameters used to calculate the signal-to-noise ratio are: △T=1X10, η=0.5, E=1.7x10J. Table 3 shows the relative value of the signal-to-noise ratio when replicating defects with different radiation temperatures on the sky background and different defect levels on the main mirror substrate.
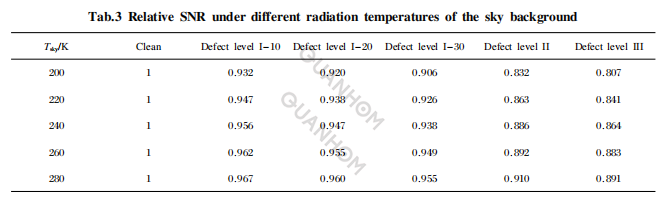
Analyzing Table 3, it can be seen that given a 300-level contamination on the surface of the primary mirror, the signal-to-noise ratio is significantly reduced as the primary mirror substrate defect level increases. In addition, when the defect level of the main mirror substrate remains unchanged, as the sky background radiation temperature rises, the influence of the contamination on the surface of the main mirror and the different defect levels of the substrate on the signal-to-noise ratio gradually decreases.
2.3.4 Discussion on the tolerance of system optical components
During the operation of the infrared optical system, when the contamination on the surface of the optical element and the defect level of the substrate are within a certain range, the detection performance of the system can be considered basically unchanged, and when the level of mirror contamination and substrate defect exceeds this limit, the system The detection performance decreases rapidly, and the allowable range of pollution and defect levels is the pollution tolerance of the system.
For infrared optical systems, the pollution tolerance of optical components can be defined as: the relative change of the signal-to-noise ratio before and after pollution needs to be controlled at about 10% to ensure effective detection of weak signals when the signal-to-noise ratio is low.
In order to ensure the detection performance of the system, that is, the change in signal-to-noise ratio caused by pollution and defects cannot be greater than 10%. According to the simulation calculation in section 2.3.3, it can be known that when the surface contamination of the main mirror is given at 300 level, when the substrate is defective it is Class II, and the relative reduction of the signal-to-noise ratio when the sky background temperature is less than 280K has exceeded 10%.
At this time, given a 300-level contamination on the surface of the primary mirror, in order to ensure the detection performance of the system, the level of defects on the optical components must be strictly controlled within level II.
In addition, in practical applications, it is necessary to further reduce the impact of particle pollution of optical components on the signal-to-noise ratio of the system through pollution monitoring and control. First of all, different pollution detection methods are used for optical components with different pollution tolerances. For the surface of the component with a large degree of contamination tolerance, once the component is observed to be dirty, clean and maintain it.
For some surfaces with stricter cleanliness requirements, a similar monitoring template can be placed near it. On-line monitoring of the component surface can be realized through the monitoring template. When it is found that the cleanliness is below the acceptable range, the monitoring sample and the contaminated components must be cleaned at the same time.
Secondly, good environmental conditions should be selected during observation, and the exposure time of the component surface should be minimized as much as possible. During the operation of the system, molecular pollution sources such as particle pollution and oil pollution should be avoided, and workers must comply with relevant pollution guidelines before and after entering the pollution control area.
In order to reduce or even eradicate component surface contamination from the source, prevention needs to be taken from the following aspects. First of all, in the system design, the pollution-sensitive components should be kept away from the pollution source as much as possible, so that the pollution source cannot directly "see" the key surface. Secondly, when selecting component materials, the characteristics and processing technology of the materials to be selected should be verified in advance.
In addition, the cleanliness of the component surface must be controlled throughout the system assembly process, and the time of component surface exposure should be minimized.
Finally, cover measures should be taken during transportation and during non-operation. In addition, once it is found that the contamination level of the component surface exceeds the tolerance, measures need to be taken to clean the surface of the component. For example, using non-contact cleaning methods such as spraying fluid can control the cleanliness of the cleaned component surface within the 250 level ( The surface coverage of contaminated particles on the component is about 0.01%).
3. Conclusion
On the basis of the meter scattering theory, using the particle contamination model and the statistical model of the substrate defect distribution, the scattering characteristics of the optical elements of different defect levels on the substrate are analyzed when the main mirror surface contamination is 300 level, and the scattering model is established.
Finally, taking the R-C telescope system as an example, the influence on the signal-to-noise ratio is calculated. Given that the surface contamination of a given component is 300, the study shows that:
(1) With the increase of the defect level of the main mirror substrate, the amount of scattering gradually increases, and the higher the defect level of the main mirror substrate, the more obvious the forward concentration, so the higher the defect level of the main mirror substrate, the replication effect the impact is more obvious;
(2)The thermal radiation analysis of the R-C telescope system shows that for the primary mirror, secondary mirror and support mirror of the element in the field of view, the stray.
The radiant flux does not change much, but for the primary mirror ring, secondary mirror ring and truss of the elements outside the field of view, the stray radiation will increase rapidly as the amount of scattering on the surface of the primary mirror increases;
(3) The analysis of the characteristics of the sun's external stray radiation shows that with the increase of the defect level of the main mirror substrate, the solar stray radiation flux received by the detector increases significantly.
(4) The analysis of the external stray radiation characteristics of the sky background shows that when the sky background temperature does not change, the stray radiation flux decreases slightly with the increase of the defect level of the main mirror substrate. When the effective radiation temperature of the sky background changes within 200~280K, the stray radiation flux of the sky background received by the detector will gradually increase with the increase of its radiation temperature;
(5) The analysis of the system signal-to-noise ratio shows that when the radiation temperature of the sky background is constant, the signal-to-noise ratio gradually decreases with the increase of the defect level of the main mirror substrate. In addition, when the defect level of the main mirror substrate remains unchanged, as the sky background radiation temperature increases, the influence of the different defect levels of the main mirror substrate on the signal-to-noise ratio gradually decreases;
(6) The tolerance analysis of the optical components of the system shows that the defect level on the optical components needs to be strictly controlled within the II level. Therefore, in practical applications, it is necessary to strictly control the surface pollution level of the optical element and the surface defect level of the substrate to ensure that the performance of the infrared optical system meets the demand.
As an expert in infrared optical lens research for many years, Quanhom can give you some professional guidance opinions to a high degree in different places.
As an experienced manufacturer of Opto-electromechanical components, Quanhom is equipped with a professional quality inspection system and a comprehensive management team and enjoys a high reputation in the industry. Our products are sold all over the world and are used in all walks of life. Our thoughtful one-stop shopping service has also received unanimous praise from customers. If you are interested in our infrared optical lenses, please contact us immediately!
Author: You Xinghai, Zhang Bin
Journal source: Vol.47 No.3 Infrared and Laser Engineering Mar.2018
Manuscript received: 2017-10-05, revised date: 2017-11-15
References
[1] Jiang Lun, Hu Yuan, Dong Keyan, et al. Passive athermal design of dual band infrared optical system [J]. Infrared and Laser Engineering, 2015,44(11): 3353-3357. (in Chinese)
[2] Facey T A, Nonnenmacher A L. Measurement of total hemispherical emissivity contaminated mirror surfaces [C]//SPIE, 1989, 967: 308-313.
[3] Spyak P R, Wolfe W L. Scatter from particulate contaminated mirrors. Part 1: theory and experiment for polystyrene spheres and =0.632 8 [J]. Optical Engineering, 1992,31(8): 1746-1756.
[4] MIL -STD -1246C. (15FEB2002) [S]. Military Standard Product Cleanliness Levels and Ccontamination Control Program, 2002.
[5] Li Fangqing, Zhang Bin, Xiao Jing, et al. Stray light analysis of the contaminated mirror of the infrared optical system[J]. Optics and Optoelectronic Technology, 2010, 8(4): 22-25. (in Chinese)
[6] Pierre Y Bely, Matt Lallo, Larry Petro. Stray light analysis of the yardstick mission [DB/OL]. [1999 -07 -23].http:// www.ngst.stsciedu/nms/main/repo.
[7] Tribble A C, Boyadjian B, Davis J, et al. Contamination control engineering design guidelines for the aerospace community [R]. Alabama, Marshall Space Flight Center: NASA Contractor Report, 1996: 4740.
[8] He P, Xiao J, Zhang B, et al. The influence of contaminated mirror on the flux distributions of stray radiation of infrared telescope systems [C]//SPIE, 2010, 7654: 76540T.
[9] Xiao Jing, Zhang Bin. Influence of the optical components contamination on the signal to nosie ratio in infrared optical systems [J]. Infrared and Laser Engineering, 2012, 41 (4): 1010-1016. (in Chinese)
[10] Wu Jianpeng, Luo Wenfei, Peng Jiaqi, et al. Influence of particle cluster contamination on the stray light radiation of infrared optical systems [J]. Journal of Sichuan University (Engineering Science Edition), 2010, 8(4): 22-25. (in Chinese)
[11] Dave J V. Scattering of visible light by large water spheres[J]. Applied Optics, 1969, 8(1): 155-164.
[12] Zhang Wei, Lu Yuan, Du Shiming, et al. Analysis of characteristics of Mie scattering [J]. Optical Technique, 2010, 36(6): 936-939. (in Chinese)
[13] Wang Xueyan. Research on particle size test algorithm based on Mie theory [D].an Technological University,2011. (in Chinese)
[14] Craig F Bohren, Donald R Huffman. Absorption and Scattering of Light by Small Particles [M]. US: John Wiley & Sons, Inc., 1998: 234-288.
[15]Aikens D M, Wolfe C R, Lawson J K. The use of Power Spectral Density (PSD) functions in specifying optics for the National Ignition Facility[C]//SPIE, 1995, 2576: 281-292.
[16] Yan Peipei, Fan Xuewu. Optical design and stray light analysis of R -C system [ J ] . Infrared Technology , 2011 , 33 (4): 214-218. (in Chinese)
[17] Zhou Lidan. Research on statistical law between optical component "defects" distribution and nea field quality in high power laser system [D]. Mianyang: China Academy of Engineering Physics, 2009. (in Chinese)
[18] You Xinghai, Hu Xiaochuan, Peng Jiaqi, et al. Effect of defects of component on stray radiation characteristics of infrared optical system [J]. Infrared and Laser Engineering, 2017, 46(1): 0120004. (in Chinese)
[19] Xu Deyan, Wang Qing, Gao Zhishan, et al. Current Optical Components Detection and International Standards [M]. Beijing: Science Press, 2009: 264-267. (in Chinese)
[20] Shan Yongguang, Liu Xiaofeng, He Hongbo, et al. Research progress of nodular defect in optical coatings [J]. High Power Laser and Particle Beams, 2011, 23(6): 1421-1429.(in Chinese)
[21] Tribble A C, Boyadjian B, Davis J, et a1. Contamination control engineering design guidelines for the aerospace community NASA Contractor Report [R]. Alabama: Marshall Space Flight Center, 1996: 4740.
[22] Chen P T, Hedgeland R J, Thomson S R. Surface accommodation of molecular contaminants [C]//Optical System Contamination: Effects, Measurement, Control II. International Society for Optics and Photonics, 1990: 327-336.
[23] Vest C E, Buch R M, Lenkevich M J. Materials selection as related to contamination of spacecraft surfaces [J]. Sampe Quarterly, 1988, 19(2): 29-35.
[24] Lei Min, Li Xiaoping, Miao Huaikun. Development of contamination control techniques for EUV optics surfaces [J]. Laser & Optoelectronics Progress, 2013, 50 (3): 030005. (in Chinese)